Landing pages (GA4)
Sessions, engagement, users and key events per landing page from Google Analytics 4, by channel, joined with Search Console clicks, impressions and position.
Landing pages shows what happens after the click: for each page visitors land on, how many sessions it received, how engaged they were and how many key events they triggered, split by acquisition channel. When the project also has Search Console linked, the same table carries the page's clicks, impressions and position, so ranking and outcome sit side by side.
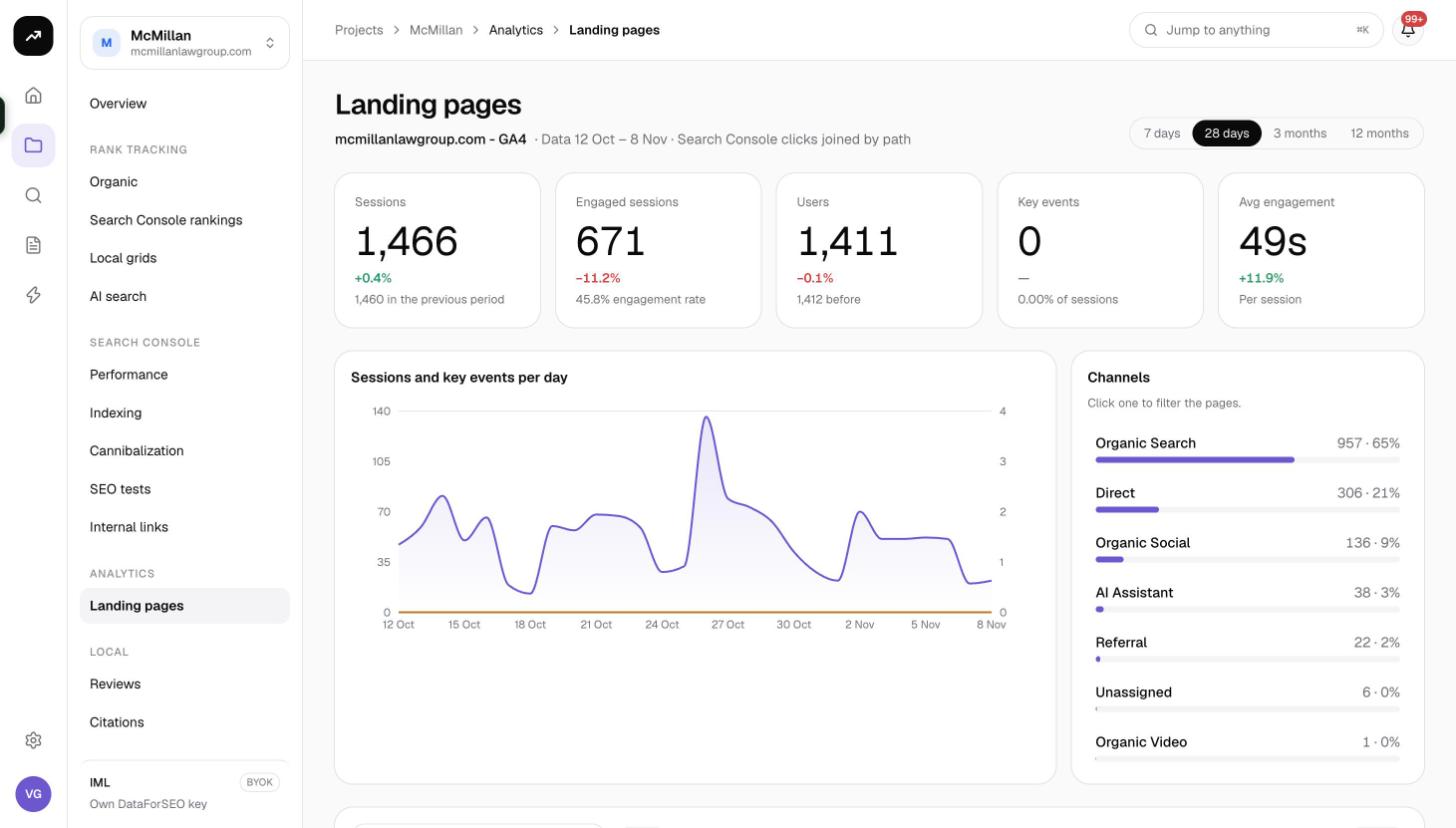
What it does
GA4 data is synced every day at 04:00 UTC into SmarterSEO and kept, so the range you can analyse grows over time rather than being limited by GA4's own retention settings. Query strings are stripped from landing page URLs and the resulting duplicate rows are merged, which makes the table far more readable than the raw GA4 report.
Cost: Free. GA4 syncs never use credits.
Before you start
- The project needs a linked GA4 property. On the project's Connections page, use Add property in the Google Analytics 4 card and pick an Initial backfill of 3, 6, 12 (default) or 24 months. See Connect Google Search Console and GA4.
- For the Search Console columns, link a Search Console property to the same project.
- The first backfill has to finish before the page shows data.
Choosing a range
Pick 7 days, 28 days (default), 3 months or 12 months. Every number is compared against the previous period of the same length.
Reading the results
Tiles
| Tile | Meaning |
|---|---|
| Sessions | Sessions that started on any landing page in the range, with the change against the previous period. |
| Engaged sessions | Sessions GA4 counts as engaged (10 seconds or more, a key event, or two or more page views), with the engagement rate. |
| Users | Distinct users. |
| Key events | Total key events (conversions), with the share of sessions that produced one. |
| Avg engagement | Average engagement time per session. |
Chart
Sessions and key events per day plots both series across the range so you can see whether traffic and outcomes move together.
Channels
The Channels block lists GA4's default channel groups (Organic Search, Direct, Referral, Paid Search, Organic Social and so on) with their sessions. Click a channel to filter the landing page table to sessions from that channel; click it again to clear. Filtering to Organic Search is the natural view for SEO work.
Table
| Column | Meaning |
|---|---|
| Landing page | The page path, with query strings removed. |
| Sessions | Sessions that started on the page. |
| Engaged | Engaged sessions. |
| Eng. rate | Engaged sessions divided by sessions. |
| Avg time | Average engagement time. |
| Users | Distinct users who landed on the page. |
| Key events | Key events triggered in those sessions. |
| Conv. rate | Key events divided by sessions. |
When Search Console data is available for the project, three more columns are added from the same date range: GSC clicks, Impr. and Pos. The join is by page URL, so a page with many Search Console clicks but few GA4 organic sessions points at a tracking or redirect problem worth checking.
Use CSV to export the table as filtered.
Reading the two sources together
- High impressions, low clicks, low sessions: a ranking and snippet problem. Work on the title and description; see Metadata audits.
- Healthy clicks, low engagement rate: the page does not match the intent behind the queries it ranks for. Compare with the queries in Performance.
- Good engagement, few key events: the page holds attention but does not convert. That is a page-design task rather than an SEO one, but the data tells you which pages deserve the effort.
- Sessions higher than GSC clicks: expected. Sessions include every channel, while GSC clicks are Google web search only. Filter the channel to Organic Search for a fairer comparison.
Tips and gotchas
Tip: Use the 12 months range with the Organic Search channel selected to find pages whose engagement rate fell year on year. Those are refresh candidates before they lose rankings too.
Note: GA4 reports sessions by the landing page of the session, while Search Console reports clicks by the URL that appeared in results. Redirects between the two (for example a trailing-slash redirect) can make the join miss; keep canonical URLs consistent.
- The sync keeps GA4's own channel grouping; custom channel groups in GA4 are not reflected.
- A page that only appears in GA4 and never in Search Console columns may simply be ranking on Bing or receiving traffic from other channels.