Search Console Performance
Clicks, impressions, CTR and position by query, page, device and country, with period comparison, filters and CSV export, kept beyond Google's 16 months.
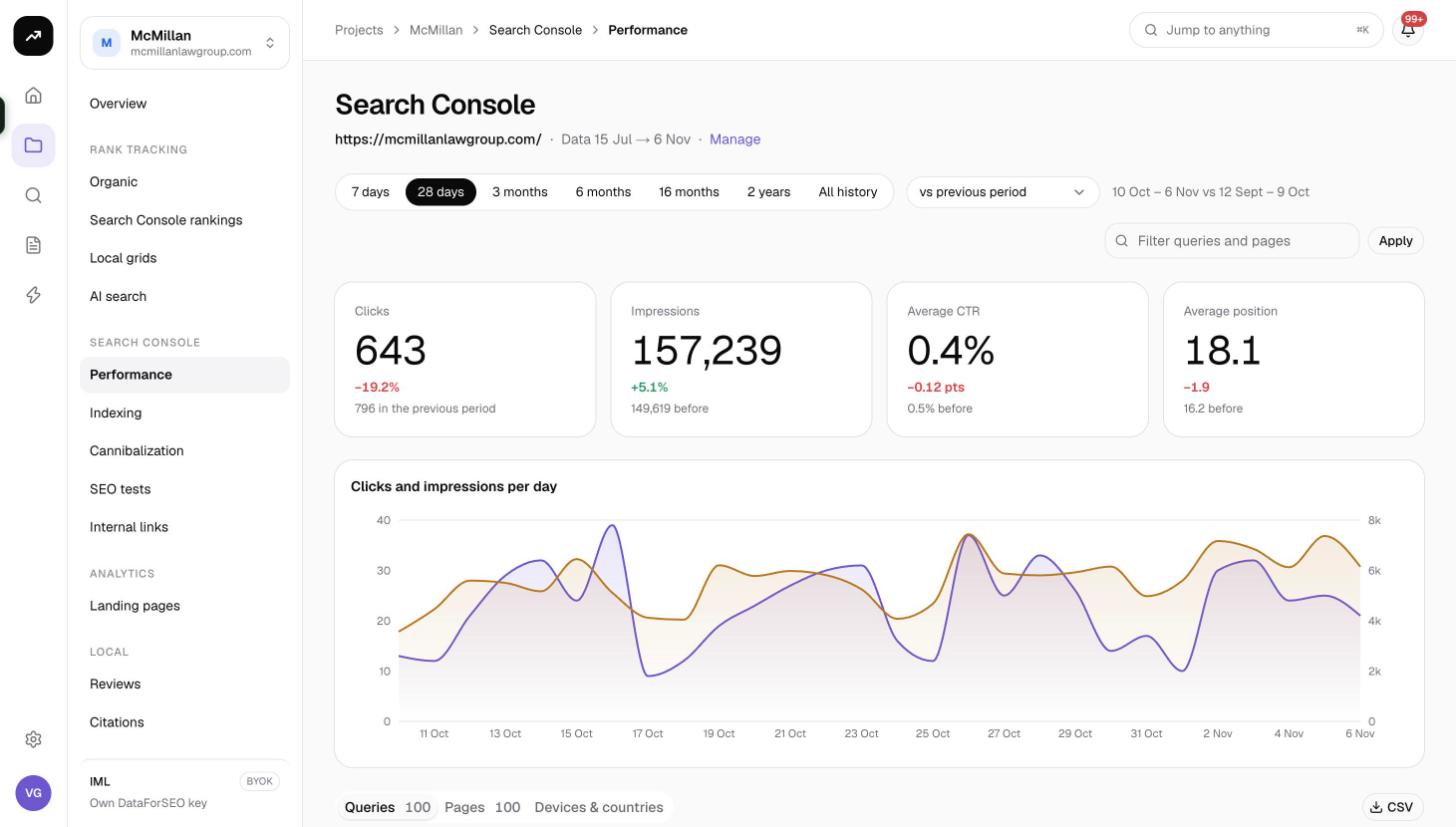
Performance is the Search Console report you already know, rebuilt on data SmarterSEO syncs every night and keeps for as long as you choose. It shows clicks, impressions, CTR and average position for the whole property, with a breakdown by query, page, device and country and a comparison against the previous period or the same period last year.
What it does
Google's own interface only goes back 16 months. Because SmarterSEO stores each day's data as it arrives, you can compare this year against last year with full detail, and after the retention window the data is rolled up into weekly totals rather than disappearing. The page is read-only; nothing here changes anything in Google.
Cost: Free. Reading and syncing Search Console data never uses credits.
Before you start
- The project needs a linked Search Console property. See Connect Google Search Console and GA4.
- Data appears once the initial backfill has finished. The header shows "Data {first} → {last}" so you know what range is available, and a Manage link takes you to the project's Connections page.
- If the project has more than one property linked, use the property picker in the header to switch.
Choosing a range and comparison
- Pick a range: 7 days, 28 days (the default), 3 months, 6 months, 16 months, 2 years or All history.
- Pick what to compare against: vs previous period (default) or vs same period last year. The year-on-year comparison shifts by exactly 52 weeks so weekdays line up with weekdays.
- Optionally type into Filter queries and pages and click Apply. The filter narrows every tile, the chart and both tabs to matching queries and pages.
Two small labels next to the range tell you how the numbers were built:
- · by week appears on long ranges, where the chart and tables use weekly summaries instead of daily rows.
- · partial appears when the comparison period starts before your synced history, so the comparison covers only part of the previous period. Treat the deltas with care in that case.
Reading the results
Tiles
| Tile | What it shows |
|---|---|
| Clicks | Total clicks in the range, with the change against the comparison period. |
| Impressions | Total impressions, with the change. |
| Average CTR | Clicks divided by impressions. The change is shown in percentage points, not percent. |
| Average position | Impression-weighted average position. A lower number is better, so a negative change is an improvement. |
Chart
Clicks and impressions per day (or per week on long ranges) plots both series over the range, with the comparison period drawn behind it so you can see the two shapes at once.
Queries and Pages tabs
The Queries and Pages tabs have the same layout. Each row is a query or a page with:
| Column | Meaning |
|---|---|
| Query / Page | The search term or the URL. |
| Clicks | Clicks in the range. |
| Δ clicks | Change against the comparison period. Reads new when the row did not appear at all in the comparison period. |
| Impressions | Impressions in the range. |
| CTR | Clicks divided by impressions for the row. |
| Position | Average position, with ▲ or ▼ showing whether it moved up or down. |
| Pages / Queries | On the Queries tab, how many of your pages appeared for that query; on the Pages tab, how many queries the page appeared for. A high count on the Queries tab is an early sign of cannibalization. |
Tables are paged; pick 25, 50, 100 (default) or 250 rows per page.
Devices & countries
The Devices & countries tab splits the same metrics by desktop, mobile and tablet and lists the top 15 countries by clicks. Country and device totals are kept at daily detail forever, regardless of the retention setting.
CSV
The CSV button exports the rows on the current Queries and Pages pages, so set your filter and page size first if you want a specific slice.
Fine print worth knowing
The footer of the page summarises how the numbers are produced:
- Positions are impression-weighted averages, the same way Google calculates them.
- Data is final two days after the fact; the nightly sync re-pulls the last seven days so late corrections from Google are picked up.
- Days older than the property's Daily detail for setting (16 months by default) are kept as weekly totals per query and page.
Sharing with clients
The Performance view is one of the report types you can share through a public, read-only link. The shared page is the same view without the property switch or the Manage link, and the CSV button stays available to the client. See Client sharing.
Tips and gotchas
Tip: Use vs same period last year with a 3-month or 6-month range to separate seasonality from real movement. Because the comparison is shifted by 52 weeks, a Monday is always compared against a Monday.
Note: If a query shows a large Pages count and a middling position, open Cannibalization for that query to see which of your pages are splitting the impressions.
- The change on Average CTR is in points: 3.1% to 3.6% shows as +0.5, not +16%.
- Filtering by a URL fragment in Filter queries and pages is the quickest way to get a section-level report, for example
/blog/.